Introduction
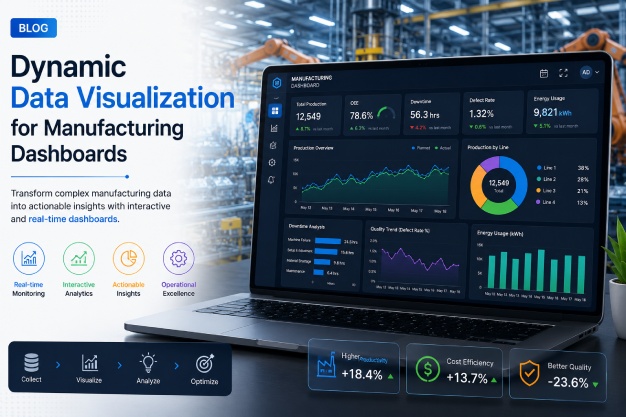
In today’s fast-paced manufacturing environment, the ability to quickly interpret complex data sets is vital. Dynamic data visualization techniques play a crucial role in designing dashboards that not only present data effectively but also enhance decision-making processes. This article explores innovative visualization methods that can transform manufacturing dashboards, ensuring they provide actionable insights and improve operational efficiency.
Table of Contents
- The Importance of Data Visualization in Manufacturing
- Key Dynamic Data Visualization Techniques
- Implementing Effective Dashboards
- Benefits of Enhanced Dashboards
- Frequently Asked Questions
The Importance of Data Visualization in Manufacturing
Data visualization is more than just a tool for displaying information; it is a fundamental component of modern manufacturing processes. By converting raw data into visual formats, businesses can identify patterns, trends, and anomalies that might not be apparent in textual data. This capability is especially relevant in manufacturing, where real-time data can significantly impact production efficiency and quality control.
Key Dynamic Data Visualization Techniques
Adopting dynamic data visualization techniques can greatly enhance the functionality and appeal of manufacturing dashboards. Here are some key techniques:
- Interactive Dashboards: Allow users to interact with data, drill down into specifics, and customize views according to their needs.
- Real-time Data Updates: Display live data to provide the most current insights, essential for time-sensitive decision-making.
- Heat Maps: Visually represent data density and distribution to quickly identify areas of concern or interest.
- 3D Visualization: Present complex data in a three-dimensional format, offering a more comprehensive view of multi-layered information.
- Predictive Analytics: Integrate forecasting tools to anticipate future trends and outcomes based on historical data.
Implementing Effective Dashboards
For a dashboard to be effective, it must be well-designed and tailored to the specific needs of its users. Consider these best practices:
- Understand User Needs: Identify the key metrics and information that users require to make informed decisions.
- Simplicity and Clarity: Avoid clutter by focusing on essential data and using intuitive visual elements.
- Consistent Design: Use a consistent color scheme and layout to enhance readability and user experience.
- Responsive Design: Ensure dashboards are accessible on various devices, from desktops to mobile phones.
Benefits of Enhanced Dashboards
Enhanced manufacturing dashboards provide numerous advantages, including:
- Improved Decision-Making: With clear and concise data presentation, decision-makers can act swiftly and accurately.
- Increased Efficiency: Real-time data updates and predictive analytics streamline operations and reduce downtime.
- Better Resource Allocation: By identifying trends and bottlenecks, businesses can optimize resource distribution.
- Enhanced Collaboration: Shareable dashboards facilitate communication and collaboration across teams and departments.
Frequently Asked Questions
What is dynamic data visualization?
Dynamic data visualization involves the use of interactive and real-time visual tools to present data, allowing users to explore and analyze information more effectively.
How can visualization improve manufacturing processes?
Visualization helps identify trends and issues quickly, enabling faster decision-making, improving efficiency, and optimizing production processes.
What tools are commonly used for data visualization?
Common tools include Tableau, Power BI, and custom software solutions developed by companies like Gravity Effects, tailored to specific industry needs.
Why is real-time data important in dashboards?
Real-time data ensures that users have the most current information, which is crucial for making timely decisions in a fast-paced manufacturing environment.
Conclusion
Dynamic data visualization is transforming the way manufacturing companies operate by providing them with insightful, actionable data. By implementing advanced visualization techniques, businesses can enhance their dashboard designs, thereby improving decision-making and operational efficiency. If you’re looking to upgrade your manufacturing dashboards, consider partnering with a trusted expert like Gravity Effects, which offers comprehensive solutions tailored to your unique needs.
Contact Gravity Effects today to learn how our innovative web development and data visualization services can elevate your manufacturing processes.
Discover more from GravityEffects
Subscribe to get the latest posts sent to your email.